Image Details
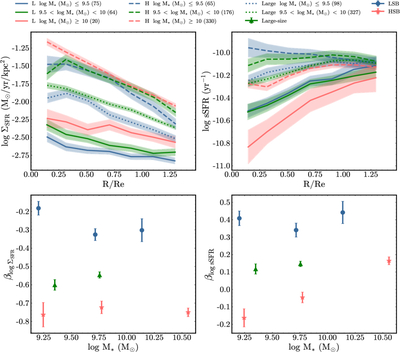
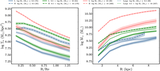
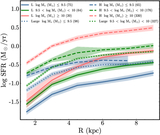
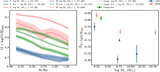
Caption: Figure 8.
Top row: radial profiles of ΣSFR and sSFR across different stellar-mass ranges. The lines in the figure correspond to those defined in Figure 7. Bottom row: relationship between the median radial gradients of ΣSFR and sSFR with stellar mass. LSB, HSB, and large-size galaxies are represented by blue circles, red stars, and green triangles, respectively, with their associated error bars.
Other Images in This Article
Show More
Copyright and Terms & Conditions
© 2026. The Author(s). Published by the American Astronomical Society.
Copyright ©
2026 Astronomy Image Explorer. All Rights Reserved.