Image Details
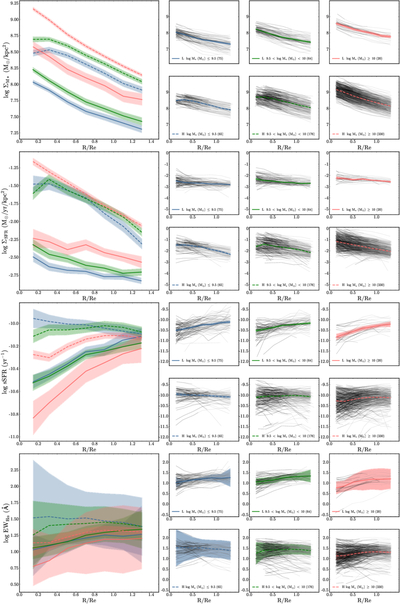
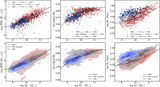
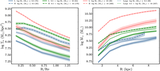
Caption: Figure D1.
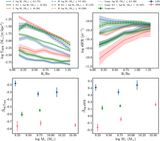
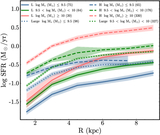
Radial distributions of Σ*, ΣSFR, sSFR, and EWHα for various stellar-mass ranges. Gray lines represent individual galaxy profiles, with the radius sampled in steps of 0.2Re along the semimajor axis. Black lines indicate the location of the bulge for the same galaxy. Median profiles are color coded by stellar-mass range, blue (log(M*/M⊙) ≤ 9.5), green (9.5 < log(M*/M⊙) < 10), and red (log(M*/M⊙) ≥ 10). Solid lines correspond to LSB galaxies, and dashed lines to HSB galaxies. Shaded areas reflect the errors of the median profile.
Other Images in This Article
Show More
Copyright and Terms & Conditions
© 2026. The Author(s). Published by the American Astronomical Society.
Copyright ©
2026 Astronomy Image Explorer. All Rights Reserved.