Image Details
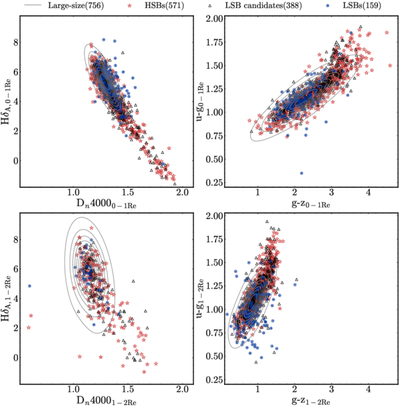
Caption: Figure C1.
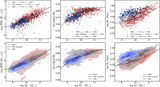
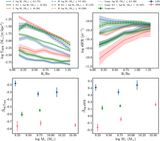
Stellar population and color distribution across radial regions. The first column shows the relationship between HδA and Dn4000 from MaNGA data, while the second column displays the u − g vs. g − z color diagram obtained from SDSS images. The top row corresponds to the inner region (0–1Re), and the bottom row corresponds to the outer region (1–2Re). In these figures, blue circles represent LSB galaxies, hollow triangles denote LSB candidates, red stars indicate HSB galaxies, and gray contours outline the distribution of large-size galaxies.
Other Images in This Article
Show More
Copyright and Terms & Conditions
© 2026. The Author(s). Published by the American Astronomical Society.
Copyright ©
2026 Astronomy Image Explorer. All Rights Reserved.