Image Details
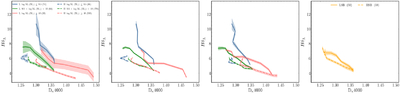
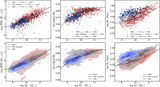
Caption: Figure 12.
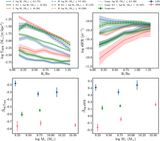
The relationship between Dn4000 and HδA, where the color coding for the different stellar-mass ranges follows the same scheme as in Figure 7. The first panel shows the results for the original sample, while the second panel presents results for a mass-matched sample. The third panel illustrates results matched for both M* and SFR, and the fourth panel displays results for a mass–SFR–size-matched sample. Due to the limited number of galaxies satisfying the mass–SFR–size matching criteria, the fourth panel is not binned by stellar mass.
Other Images in This Article
Show More
Copyright and Terms & Conditions
© 2026. The Author(s). Published by the American Astronomical Society.
Copyright ©
2026 Astronomy Image Explorer. All Rights Reserved.