Image Details
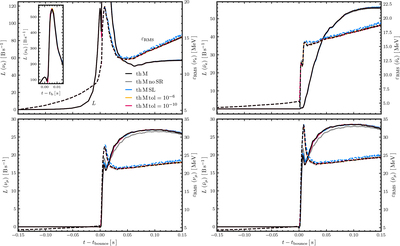
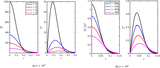
Caption: Figure 26.
Time evolution of selected neutrino quantities sampled at r = 500 km, from the same thornado+FLASH-X models shown in Figure 25. Each panel plots the luminosity (solid lines) and rms energy (dashed lines) as functions of time after bounce. Results are shown for electron neutrinos (νe; top left), electron antineutrinos (﹩{\bar{\nu }}_{{{\rm{e}}}}﹩; top right), muon neutrinos (νμ; bottom left), and muon antineutrinos (﹩{\bar{\nu }}_{\mu }﹩; bottom right).
Other Images in This Article
Show More
Copyright and Terms & Conditions
© 2026. The Author(s). Published by the American Astronomical Society.
Copyright ©
2026 Astronomy Image Explorer. All Rights Reserved.