Image Details
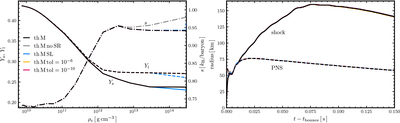
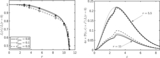
Caption: Figure 25.
Central electron fraction (Ye; solid lines), lepton fraction (Yl; dashed lines), and entropy per baryon (s; dashed–dotted lines) vs. central density during core collapse (left panel), and postbounce evolution of the shock (solid lines) and PNS (dashed lines) radii (right panel). Line colors correspond to the following thornado+FLASH-X runs: the fiducial Minerbo run with tol = 10−8 (th M; black); a model without the spectral redistribution of M. P. Laiu et al. (2025; Th M no SR; gray); a model using the slope limiter described in Section 3.3 with βTVD = 1.75 (th M SL; blue); a model with an increased nonlinear solver tolerance of tol = 10−6 (th M tol=10−6; yellow); and a model with a decreased tolerance of tol = 10−10 (th M tol=10−10; red).
Other Images in This Article
Show More
Copyright and Terms & Conditions
© 2026. The Author(s). Published by the American Astronomical Society.