Image Details
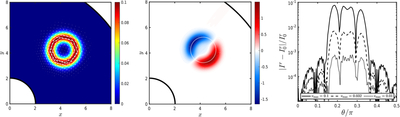
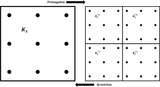
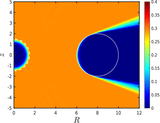
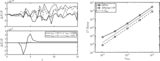
Caption: Figure 9.
Results for the transparent vortex problem. The color map (left panel) displays the magnitude of the velocity field for the model with ﹩{v}_{{{\rm{\max }}}}=0.1﹩, with velocity vectors overlaid (in white). The color map in the middle panel displays the rms energy, εrms,0 − εrms, where εrms,0 ≈ 15.6 is the value at the inner boundary (r = 2). In this panel, the dotted white line traces out the circle where ﹩v={v}_{{{\rm{\max }}}}=0.1﹩. The right panel plots the relative difference in the radial component of the energy-integrated number flux (relative to a model with ﹩{v}_{{{\rm{\max }}}}=0﹩) vs. polar angle for models with various values of ﹩{v}_{{{\rm{\max }}}}﹩: 0.1 (solid), 0.032 (dashed), and 0.01 (dotted).
Other Images in This Article
Show More
Copyright and Terms & Conditions
© 2026. The Author(s). Published by the American Astronomical Society.