Image Details
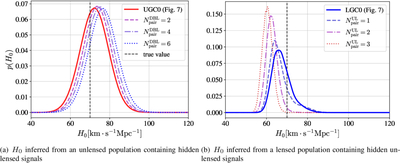
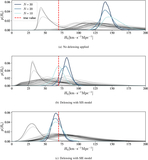
Caption: Figure 9.
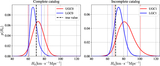
Biased H0 posteriors obtained from a subset of misclassified signals within a population where the majority are correctly classified. The left and right panels show H0 posteriors biased due to misclassification of unlensed signals as lensed, and lensed signals as unlensed, respectively, with the correctly inferred H0 from Figure 7 shown for reference. The dashed black lines denote the true value of H0. As the number of misclassified events increases, ﹩{N}_{{\rm{pair}}}^{{\rm{DBL}}}﹩ in the left panel and ﹩{N}_{{\rm{pair}}}^{{\rm{UL}}}﹩ in the right panel, the posteriors gradually shift away from the correctly inferred H0. In the left panel, they shift from the red solid line to the blue dotted line, while in the right panel, they shift from the blue solid line to the red dotted line.
Other Images in This Article
Copyright and Terms & Conditions
© 2026. The Author(s). Published by the American Astronomical Society.