Image Details
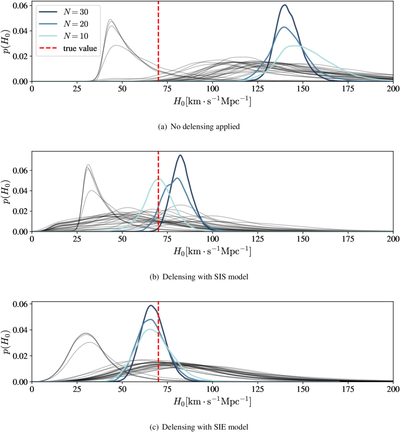
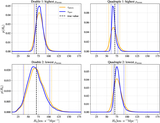
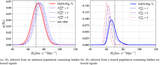
Caption: Figure 8.
H0 posteriors obtained from multiple realizations of a double-image BBH lensing system with a true SIE mass profile. Gray curves show the posterior from each individual realization, while the sky-blue (N = 10), blue (N = 20), and navy (N = 30) curves represent the progressively combined posteriors. The dashed red lines indicate the true value of H0. The top, middle, and bottom panels correspond to the cases of no delensing, SIS delensing, and delensing with the correct SIE model, respectively. In the absence of delensing, the inferred H0 is strongly biased for all realization numbers. When delensing is performed with an incorrect SIS model, the bias is less apparent for a small number of realizations but becomes increasingly significant as realizations accumulate, even though the credible intervals shrink. In contrast, delensing with the correct SIE model recovers an unbiased estimate of H0.
Other Images in This Article
Copyright and Terms & Conditions
© 2026. The Author(s). Published by the American Astronomical Society.