Image Details
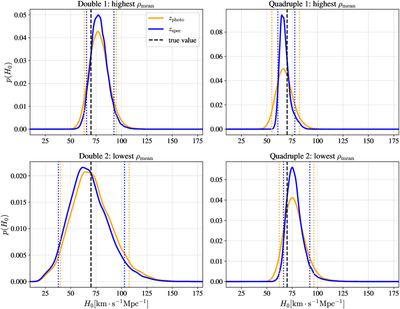
Caption: Figure 5.
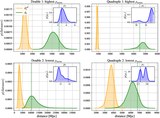
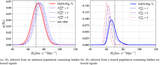
The posteriors of the Hubble constant for Cases 1 and 2 for both double- and quadruple-image systems. The solid dashed line indicates the true value, and the dotted lines denote the 90% credible intervals (C.I.s). The blue (orange) solid curve shows the case in which the redshift used to compute the recessional velocity is obtained from spectroscopic (photometric) measurements. Both Cases 1 and 2 of the quadruple-image system show well-constrained posteriors, as the luminosity distances are precisely recovered, and the delensing process performs well. In contrast, both Cases 1 and 2 of the double-image system exhibit broader C.I.s and peaks that deviate further from the true value due to less effective delensing. In addition, Case 2 of both the double- and quadruple-image systems shows broader C.I. because the precision of distance inference is lower for low-S/N signals.
Other Images in This Article
Copyright and Terms & Conditions
© 2026. The Author(s). Published by the American Astronomical Society.