Image Details
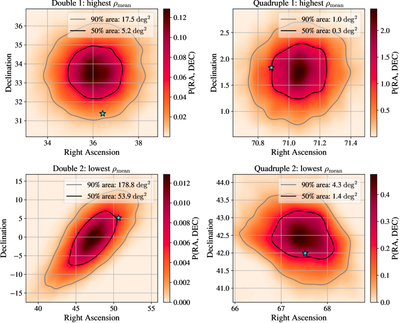
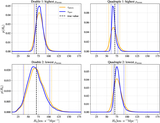
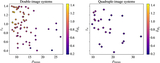
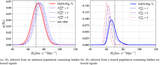
Caption: Figure 2.
Sky-localization maps for selected double- and quadruple-image systems. The left (right) panels show double (quadruple) image systems. The top row corresponds to systems with the highest ρmean, which exhibit the most tightly constrained sky localizations, while the bottom row shows systems with the lowest ρmean, showing the broader posterior regions. The black and gray solid contours represent the 50% and 90% credible regions, respectively. The star symbols mark the true sky positions of the corresponding GW lensing systems.
Other Images in This Article
Copyright and Terms & Conditions
© 2026. The Author(s). Published by the American Astronomical Society.
Copyright ©
2026 Astronomy Image Explorer. All Rights Reserved.