Image Details
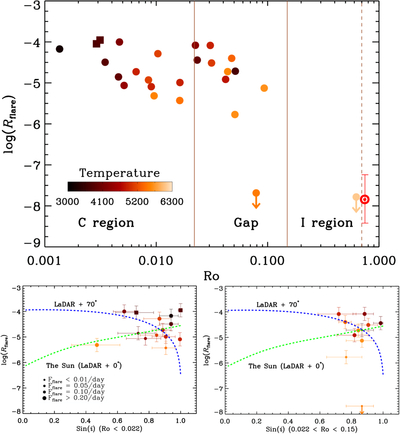
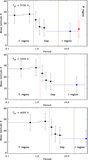
Caption: Figure 5.
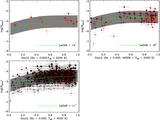
Top panel: the rotation–flaring activity relationship of 26 stars that have the TESS observations and ZDI measurements. The filled circles represent stars that are found to be high latitude by ZDI. The filled squares represent stars that are found to be without high-latitude spots by ZDI. Stars without detectable flares are plotted with downward arrows. Bottom panel: same as Figure 4, but for stars in the top panel. The green and blue dashed lines denote the solar-like and polar latitudinal distribution, respectively.
Other Images in This Article
Show More
Copyright and Terms & Conditions
© 2026. The Author(s). Published by the American Astronomical Society.
Copyright ©
2026 Astronomy Image Explorer. All Rights Reserved.