Image Details
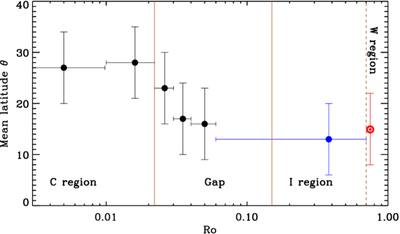
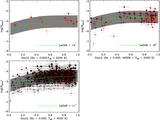
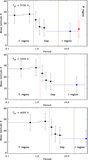
Caption: Figure 4.
Rossby number vs. the mean latitude of active regions. Each black point represents the best match between the observation and the simulated LaDAR in a Ro bin (the green dashed line in Figure 3). The blue point is obtained by the upper envelope of the sini–flaring activity relationship in Figure C3. The Sun is marked with a red ⊙ symbol. The uncertainty of the mean latitude is ±7°, which is the same as the Sun. The uncertainty of Ro represents the range of each Ro bin used to fit the sini–flaring activity relationship.
Other Images in This Article
Show More
Copyright and Terms & Conditions
© 2026. The Author(s). Published by the American Astronomical Society.
Copyright ©
2026 Astronomy Image Explorer. All Rights Reserved.