Image Details
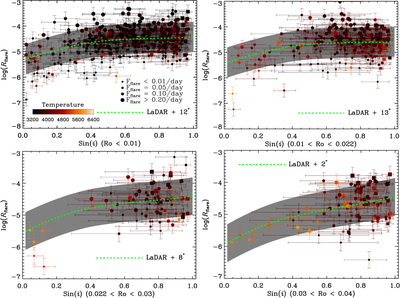
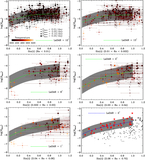
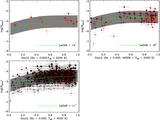
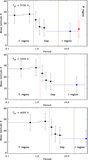
Caption: Figure 3.
Inclination sini vs. the flaring activity in different Ro bins. The size of the filled circles represents the flaring frequency of a star. The green dashed line represents the best match of the stellar LaDAR. The shaded region represents the uncertainty caused by the maximum and minimum of the solar cycle. The uncertainty of log﹩{R}_{{\rm{flare}}}﹩ is 0.26 dex, which is from the error propagation of the flare energy. The uncertainty of sini is from the 16th and 84th percentiles of the posterior probability distribution of sini.
Other Images in This Article
Show More
Copyright and Terms & Conditions
© 2026. The Author(s). Published by the American Astronomical Society.
Copyright ©
2026 Astronomy Image Explorer. All Rights Reserved.