Image Details
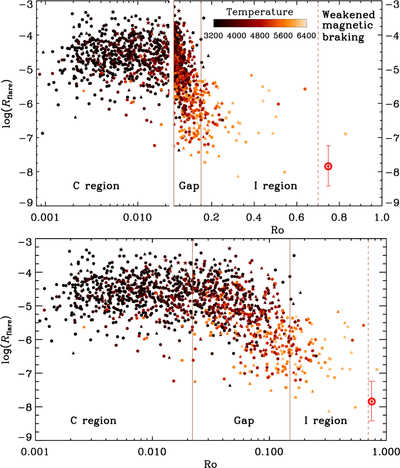
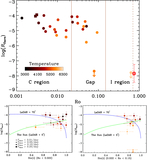
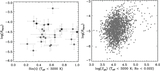
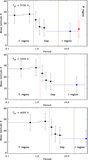
Caption: Figure 1.
Top panel: the rotation–flaring activity relationship separated into four regions according to the CgIW scenario. The C region is shown in a log–log plane for clarity, and the other regions are shown in a linear–log plane. The x-axis is the Ro (the ratio of the rotation period to the global convective turnover time). The vertical lines are Ro = 0.022, 0.15, and 0.70, respectively. The shapes of the symbols refer to the following star types: filled circle = dwarf; filled triangle = binary; and filled star = subgiant. The Sun is denoted by the red ⊙ symbol. Bottom panel: the same as the top panel, but is shown in a log–log plane for the entire sample.
Other Images in This Article
Show More
Copyright and Terms & Conditions
© 2026. The Author(s). Published by the American Astronomical Society.