Image Details
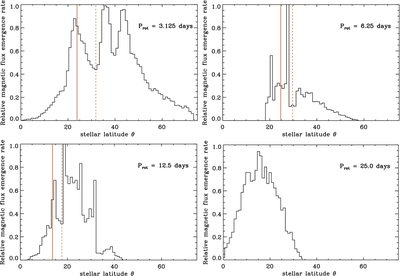
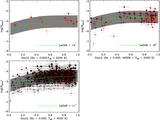
Caption: Figure C7.
A dynamo simulation on the latitudinal distribution of the magnetic flux emergence for different rotation periods. The data in the top left panel is from E. Işık et al. (2024), and the others are from E. Işık et al. (2018). The vertical dashed lines separate the lower component of the distributions that are associated with low-latitude spots and small-scale fields. The vertical solid lines denote the mean latitudes of the lower components.
Other Images in This Article
Show More
Copyright and Terms & Conditions
© 2026. The Author(s). Published by the American Astronomical Society.
Copyright ©
2026 Astronomy Image Explorer. All Rights Reserved.