Image Details
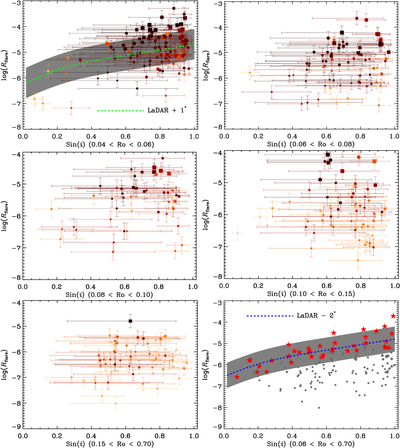
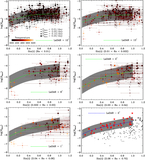
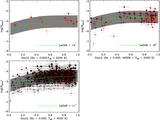
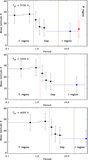
Caption: Figure C3.
Same as Figure 3, but for several larger Ro bins. The bottom right panel shows the relation in the range of 0.06 < Ro < 0.7. We take stars larger than the 84th percentile (or at least three stars) in each sini bin as the upper envelope of the relation. Stars observed in the upper envelope are denoted by the red filled stars.
Other Images in This Article
Show More
Copyright and Terms & Conditions
© 2026. The Author(s). Published by the American Astronomical Society.
Copyright ©
2026 Astronomy Image Explorer. All Rights Reserved.