Image Details
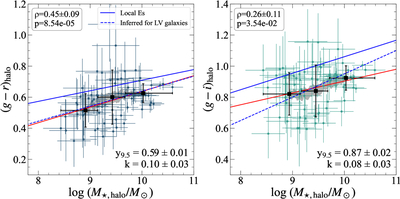
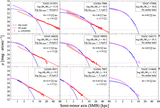
Caption: Figure 14.
Stellar halo colors are plotted against stellar halo masses for our galaxies. Results for the (g − r)halo and (g − i)halo are, respectively, shown in the left and right panels. The blue solid lines show the color–mass relation of local elliptical galaxies, while the blue dashed lines represent the relation inferred from the halo mass–metallicity correlation of the stellar halos of 14 Local Volume MW-mass galaxies (A. Smercina et al. 2022). The Spearman rank correlation coefficients, their uncertainties, and the p-values are listed in the upper-left corners. Running average and the rms scatter are shown as the gray shaded region. Large black squares with error bars indicate the average and central 68% scatter of galaxies in three separate galaxy mass intervals. The best-fit linear relations (color = ﹩k\times ({\rm{log}}{M}_{\star }-9.5)+{y}_{9.5}﹩) for our sample are shown as red lines, and the best-fit slope (k) and intercept at ﹩{\rm{log}}{M}_{\star }/{M}_{\odot }=9.5﹩ (y9.5) are also provided. See Section 4.5 for details.
Other Images in This Article
Show More
Copyright and Terms & Conditions
© 2026. The Author(s). Published by the American Astronomical Society.