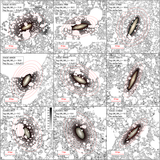
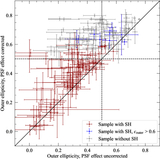
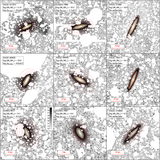
Image Details
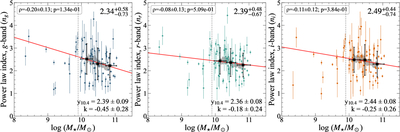
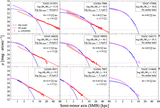
Caption: Figure 11.
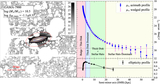
Power-law indices of stellar halo profiles are plotted against the host galaxy stellar mass. Results for the g-band profiles, r-band profiles, and i-band profiles are, respectively, shown in the left, middle, and right panels. The median and central 68% range of the indices for galaxies with ﹩{\rm{log}}{M}_{\star }/{M}_{\odot }\gt 9.9﹩ (vertical gray dotted lines) are listed in the upper-right corners. The Spearman rank correlation coefficients, their uncertainties, and the p-values are listed in the upper-left corners. Running means and the rms scatters are shown as the gray shaded region. Large black squares with error bars indicate the mean and central 68% scatter of galaxies in three nonoverlapping galaxy mass intervals. The best-fit slope (k) and intercept at ﹩{\rm{log}}{M}_{\star }/{M}_{\odot }=10.4﹩ (y10.4) are also provided, where ﹩n=k\times ({\rm{log}}{M}_{\star }-10.4)+{y}_{10.4}﹩, and 10.4 is the median logarithmic stellar mass of galaxies with halo detection. See Section 4.2 for details.
Other Images in This Article
Show More
Copyright and Terms & Conditions
© 2026. The Author(s). Published by the American Astronomical Society.