

Image Details
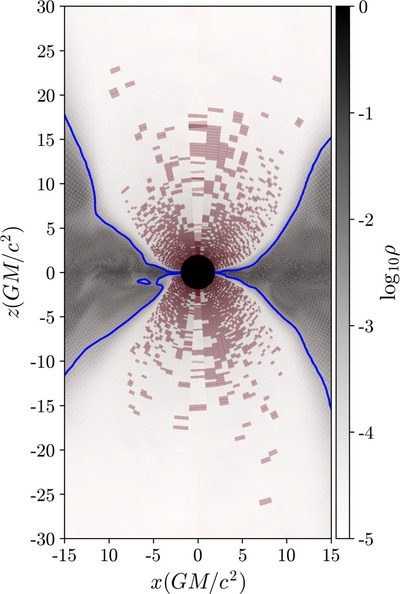
Caption: Figure 22.
A snapshot from the MAD a* = +0.5 simulation. Grid zones where σ exceeds ﹩{\sigma }_{{\rm{\max }}}﹩ are highlighted in red, while the blue contour indicates σ = 1. The underlying grayscale shading shows the logarithm of the rest-mass density in code units. The exponential radial coordinate focuses zones near the event horizon. Since σ peaks at the base of the jet, a substantial fraction of grid zones reach the σ ceiling in MAD simulations (see Figure 20).
Other Images in This Article
Show More
Copyright and Terms & Conditions
© 2025. The Author(s). Published by the American Astronomical Society.

Copyright ©
2026 Astronomy Image Explorer. All Rights Reserved.
