

Image Details
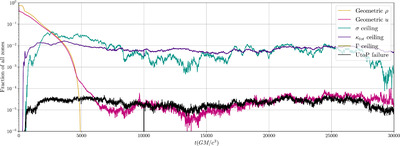
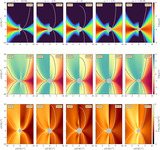
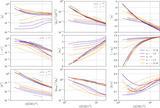
Caption: Figure 21.
Similar to Figure 20, but for SANE a* = +0.5. Compared to the MAD model, there are fewer flow hits, with the largest contributions coming from the entropy and σ ceilings.
Other Images in This Article
Show More
Copyright and Terms & Conditions
© 2025. The Author(s). Published by the American Astronomical Society.

Copyright ©
2026 Astronomy Image Explorer. All Rights Reserved.
