

Image Details
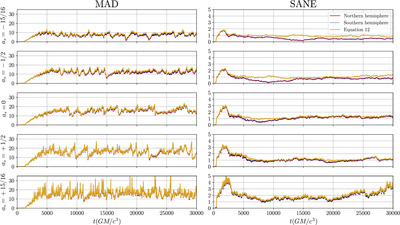
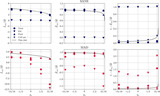
Caption: Figure 16.
A time series of the dimensionless magnetic flux crossing the event horizon for all of the models in v3. Left column: MAD; right column: SANE simulations. Rows (from top to bottom): increasing spin from a* = −15/16 to a* = +15/16. The gray line plots the flux as computed according to Equation (12), while the gold and magenta lines plot ﹩{{\rm{\Phi }}}_{\rm{BH}\,}^{\,\rm{N}}﹩ (Equation (A1)) and ﹩{{\rm{\Phi }}}_{\rm{BH}\,}^{\,\rm{S}}﹩ (Equation (A2)), respectively.
Other Images in This Article
Show More
Copyright and Terms & Conditions
© 2025. The Author(s). Published by the American Astronomical Society.

Copyright ©
2026 Astronomy Image Explorer. All Rights Reserved.
