

Image Details
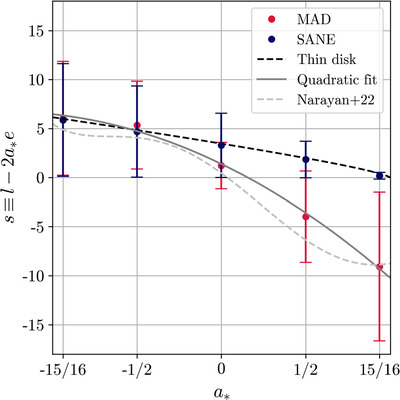
Caption: Figure 15.
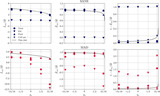
The spin-up parameter “s” is given by Equation (30). The markers indicate the time-averaged value, and error bars represent 1σ. Red and blue markers are MAD and SANE simulations, respectively. The black dashed line is the expected thin-disk values (Equation (31)). The solid gray line is the quadratic fit (Equation (32)), and the dashed silver line is the fifth-order polynomial fit provided in R. Narayan et al. (2022).
Other Images in This Article
Show More
Copyright and Terms & Conditions
© 2025. The Author(s). Published by the American Astronomical Society.

Copyright ©
2026 Astronomy Image Explorer. All Rights Reserved.
