Image Details
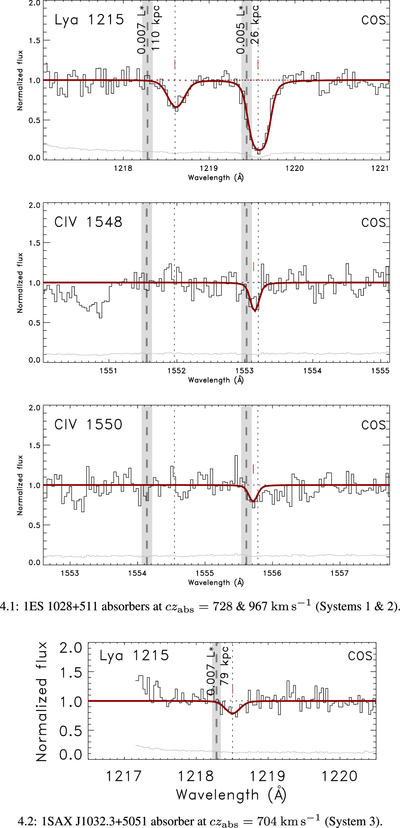
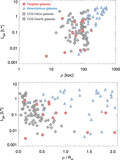
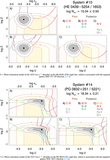
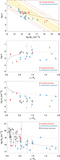
Caption: Figure 4. Absorption-Line Fits for H I and associated metal lines detected by COS, STIS, or FUSE for all absorbers listed in Table 3
The complete figure set (45 images) is available in the online journal.
Absorption-line fits for H I and associated metal lines detected by COS, STIS, or FUSE for all absorbers listed in Table 3. The species name and the provenance of the spectrum are labeled in each individual panel. Dotted vertical lines show ﹩\mathrm{Ly}\alpha ﹩ component velocities and dashed vertical lines with gray shaded areas show the nearest galaxy velocity and ﹩1\sigma ﹩ uncertainty; the luminosity of this nearest galaxy and its impact parameter from the QSO sight line are also labeled. The horizontal dotted line shows the continuum fit, dotted red lines show Voigt profile fits to individual velocity components, and the solid red line shows the total fit to all components. When absorption is confused by the presence of gas at another redshift, the relevant portion of the spectrum is still shown but not fit by a Voigt profile.
Other Images in This Article
Show More
Copyright and Terms & Conditions
© 2017. The American Astronomical Society. All rights reserved.