Image Details
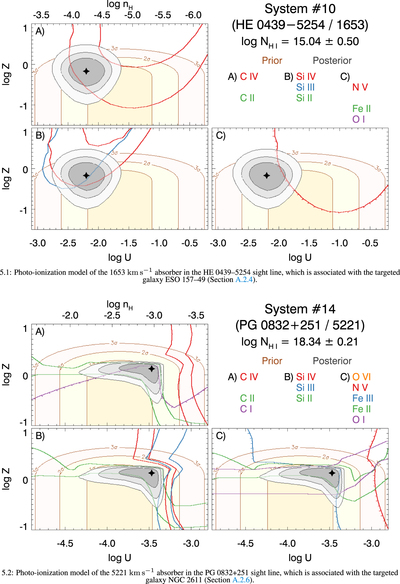
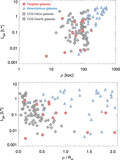
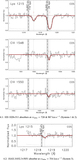
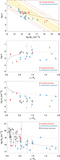
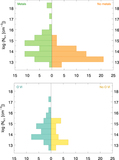
Caption: Figure 6. CLOUDY Photo-Ionization Models
The complete figure set (25 images) is available in the online journal.
CLOUDY photoionization models for all absorbers in Table 9. Metal-line detections are indicated with solid ﹩1\sigma ﹩ contours enclosing the allowable region of parameter space, and ﹩3\sigma ﹩ upper limits are shown with tick marks pointing toward the allowable region of parameter space. Panel A shows the carbon ions, Panel B shows the silicon ions, and Panel C shows everything else, color-coded by species. The prior and posterior distributions for a given absorber are identical in all three panels.
Other Images in This Article
Show More
Copyright and Terms & Conditions
© 2017. The American Astronomical Society. All rights reserved.