Image Details
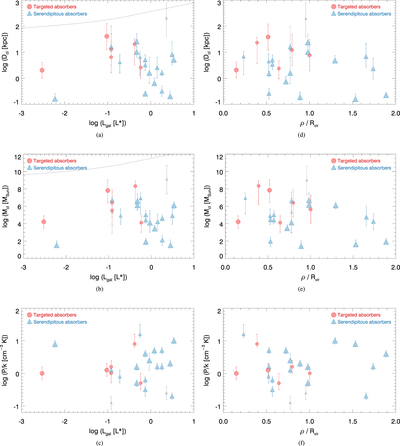
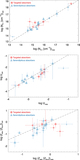
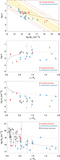
Caption: Figure 8.
Distributions of ﹩{D}_{\mathrm{cl}}﹩, ﹩{M}_{\mathrm{cl}}﹩, and ﹩\langle P/k\rangle ﹩ as a function of nearest galaxy luminosity (Panels a–c) and normalized impact parameter (Panels d–f). As in Figure 7, symbol size is indicative of our confidence in the photoionization models (i.e., our absorber grades) with higher-confidence absorbers having larger plot symbols; the two grade D absorbers are colored gray. No obvious trends are present in any of the panels, in agreement with Figures 12–14 of Paper I. The dotted lines in Panels a–b show the galaxy’s virial diameter and mass, respectively, as a function of luminosity.
Other Images in This Article
Show More
Copyright and Terms & Conditions
© 2017. The American Astronomical Society. All rights reserved.