

Image Details
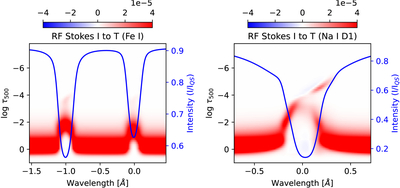
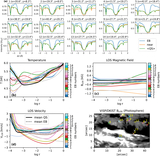
Caption: Figure B1.
Response functions of the Fe I 6301 line pair (left) and the Na I D1 line (right) to temperature as functions of optical depth and wavelength at the EB location. The blue profiles represent the observed intensity. The color bar in each panel shows the magnitude of response functions.
Other Images in This Article
Copyright and Terms & Conditions
© 2026. The Author(s). Published by the American Astronomical Society.

Copyright ©
2026 Astronomy Image Explorer. All Rights Reserved.
