

Image Details
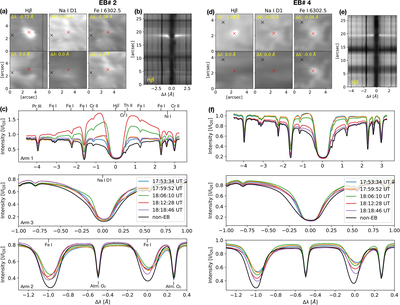
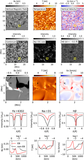
Caption: Figure 2.
Multiline appearance of EBs in the DKIST/ViSP observations (Hβ, Na I, and Fe I lines). Left column ((a), (b), and (c)): (a) images of EB #2, corresponding to box 2 in Figure 1, shown in the blue wings and line cores of different spectral lines. Red and blue crosses mark EB and non-EB locations. (b) Vertical spectral cut across the EB in Hβ, where the y-axis represents the spatial position along the slit and the x-axis denotes wavelength, illustrating the “mustaches” signature of the EB. (c) Temporal evolution of the EB spectra in three ViSP arms at the location marked by the red cross in the top panels. The black profiles represent non-EB spectra at a pixel away from the EB site, marked as the black cross symbol in the top panels. Right panels ((d), (e) and (f)): same as left panels, but for EB# 4, outlined with box 4 in Figure 1.
Other Images in This Article
Copyright and Terms & Conditions
© 2026. The Author(s). Published by the American Astronomical Society.

