

Image Details
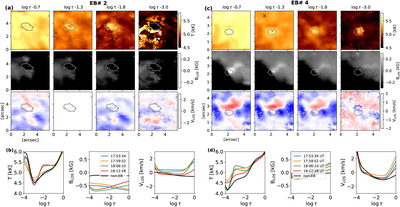
Caption: Figure 3.
Stratification of physical parameters inferred from ViSP multiline inversion. Left panels: (a) shows the retrieved atmospheric parameters (temperature, LOS magnetic field, and LOS velocity) at different optical depths for EB# 2 highlighted in Figure 1 and 2. The gray contours outline the heated EB location. Panel (b) displays the temporal evolution of the inferred parameters at the EB pixel marked by the red cross, whereas the black line refers to the non-EB reference pixel marked as the black cross in the panel (a). Right panels ((c) and (d)): same as left, but for the EB# 4 highlighted in Figure 1 and 2.
Other Images in This Article
Copyright and Terms & Conditions
© 2026. The Author(s). Published by the American Astronomical Society.

