

Image Details
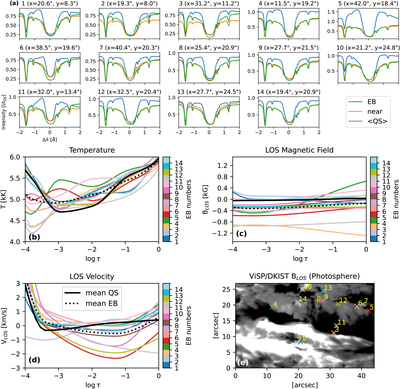
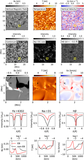
Caption: Figure 4.
Spectral profiles and inferred model atmospheres of 14 EBs. (a) Hβ spectral profiles at the EB pixel (blue), a nearby non-EB pixel (orange), and the average QS profile (green). The title of each panel indicates the EB label and location. Bottom panels: inferred temperature (b), LOS magnetic field (c), and LOS velocity (d) at the EB locations. The solid and dashed black profiles represent the mean QS atmosphere and the mean atmosphere of the 14 EBs, respectively. (e) Spatial locations of all 14 unique EBs identified in the four ViSP raster maps, marked by crosses (“×”) on the photospheric LOS magnetic-field map (saturated at ±500 G), where white and black colors refer to positive and negative polarities, respectively.
Other Images in This Article
Copyright and Terms & Conditions
© 2026. The Author(s). Published by the American Astronomical Society.

