

Image Details
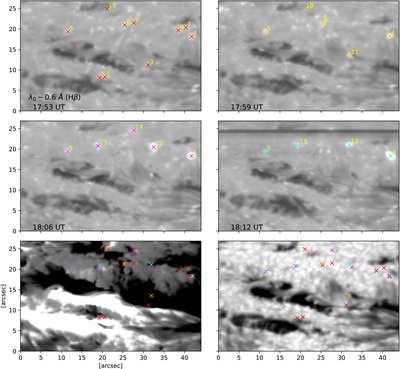
Caption: Figure A1.
EB identification using intensity-threshold criteria. Top four panels: ViSP/DKIST Hβ blue-wing intensity images showing the identified EBs, marked by crosses (“×”) and labeled accordingly. Different “×” colors refer to different raster maps. Bottom left panel: LOS magnetic field inferred from the photospheric ViSP Fe I 6302 Å line, where white and black represent positive and negative magnetic polarities, respectively. The magnetic field is saturated at ±500 G. The crosses indicate the locations of the identified EBs within the magnetic region. Bottom right panel: same as the bottom left panel, but showing the continuum intensity.
Other Images in This Article
Copyright and Terms & Conditions
© 2026. The Author(s). Published by the American Astronomical Society.

