

Image Details
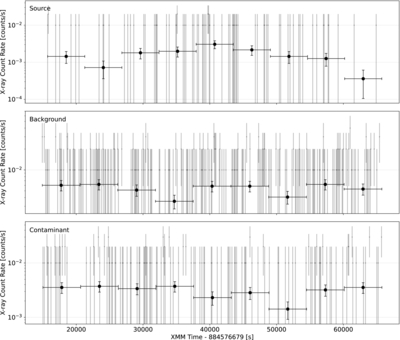
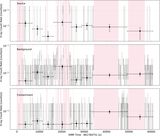
Caption: Figure A3.
Light curves for source (top), background (middle), and contaminant (bottom) showing photon counts over time for the 2026 data. Gray points show data binned to 100 s with error bars generated from the XMM-Newton Science Analysis System pipeline. The absence of lines indicates zero counts. Black points show 5600 s bins, which were chosen to include a minimum of one count for the source aperture. Error bars show errors added in quadrature.
Other Images in This Article
Copyright and Terms & Conditions
© 2026. The Author(s). Published by the American Astronomical Society.

Copyright ©
2026 Astronomy Image Explorer. All Rights Reserved.
