

Image Details
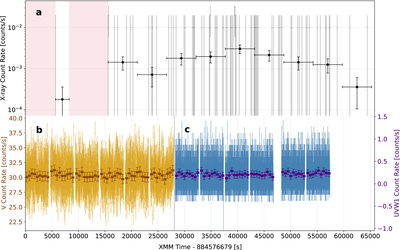
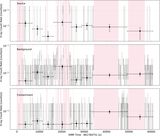
Caption: Figure 2.
Light curves for EPIC PN (a), OM V filter (b), and OM UVW1 filter (c). Shaded pink regions show omitted periods of high background noise and/or interrupted data collection. These regions are not included in the spectral modeling. In panel (a), gray points show data binned to 100 s with error bars generated from the XMM-Newton SAS pipeline. The absence of lines indicates zero counts. Black points show 5600 s bins, which include a minimum of one count for the source aperture and errors added in quadrature. In panels (b) and (c), smaller points have 10 s bins with error bars generated from the PPS pipeline, and larger points have 500 s bins, with errors added in quadrature.
Other Images in This Article
Copyright and Terms & Conditions
© 2026. The Author(s). Published by the American Astronomical Society.

