

Image Details
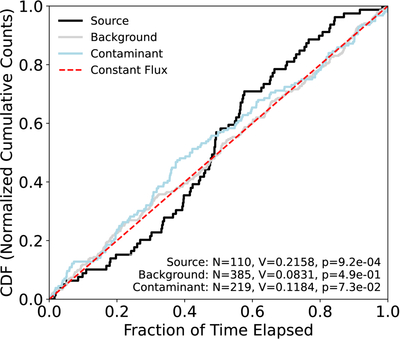
Caption: Figure A4.
Kuiper test for X-ray variability. Black, gray, and blue lines show the cumulative distribution function (CDF) computed from the source, background, and contaminant apertures, respectively. CDFs were constructed by summing counts in time. Each CDF was compared to a constant flux (red dashed line). The resulting Kuiper scores and p-values are shown. P-values indicate the probability that each observed CDF is consistent with a constant flux. The results are summarized in Table 2.
Other Images in This Article
Copyright and Terms & Conditions
© 2026. The Author(s). Published by the American Astronomical Society.

Copyright ©
2026 Astronomy Image Explorer. All Rights Reserved.
