

Image Details
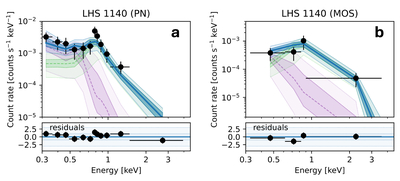
Caption: Figure 1.
X-ray spectral analysis. The best-fit models and residuals are plotted for the EPIC PN detector (a) and for the combined EPIC-MOS detectors (b). The soft APEC component is plotted in purple, and the hard component is plotted in green. The combined model is shown in blue. Dashed lines indicate median values, while shaded areas indicate standard deviation.
Other Images in This Article
Copyright and Terms & Conditions
© 2026. The Author(s). Published by the American Astronomical Society.

Copyright ©
2026 Astronomy Image Explorer. All Rights Reserved.
