

Image Details
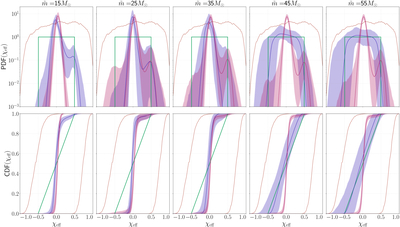
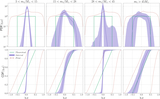
Caption: Figure A2.
Inferred effective-spin distributions for different choices of the transition mass scale ﹩\tilde{m}﹩. Columns correspond to ﹩\tilde{m}=15,\,25,\,35,\,45,﹩ and 55 M⊙, respectively. The top panels show the inferred probability density functions, while the bottom panels show the corresponding cumulative distribution functions. Blue and pink curves indicate the two populations below and above ﹩\tilde{m}﹩, respectively. Shaded regions denote the 90% credible intervals, and solid lines denote the median. The green curve shows the uniform distribution expected for hierarchical mergers in dense clusters (F. Antonini et al. 2025b). The red dashed curves indicate the broad isotropic-spin priors used in the analysis.
Other Images in This Article
Copyright and Terms & Conditions
© 2026. The Author(s). Published by the American Astronomical Society.

