

Image Details
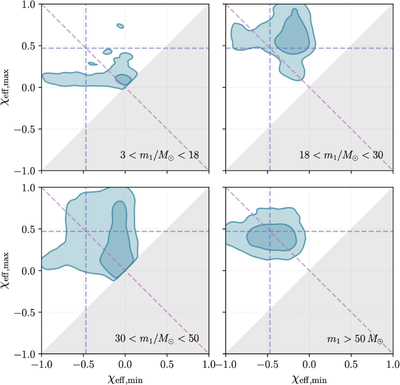
Caption: Figure 5.
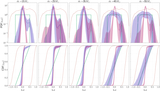
Posterior support for the minimum and maximum extent of the inferred effective-spin distributions across the four mass intervals identified from the mass-ratio analysis: m1 < 18 M⊙, 18 < m1/M⊙ < 30, 30 < m1/M⊙ < 50, and m1 > 50 M⊙. Contours at 95% and 68% confidence show the inferred joint posterior on ﹩{\chi }_{{\rm{eff}},{\rm{\min }}}﹩ and ﹩{\chi }_{{\rm{eff}},{\rm{\max }}}﹩ for each interval. The low-mass population is strongly concentrated toward small values of ﹩{\chi }_{{\rm{eff}},{\rm{\max }}}﹩, while the higher-mass intervals exhibit progressively broader support extending toward larger positive and negative effective spins. The blue dashed lines indicate ﹩{\chi }_{{\rm{eff}},{\rm{\min }}}=-0.47﹩ and ﹩{\chi }_{{\rm{eff}},{\rm{\max }}}=0.47﹩, approximately corresponding to the characteristic support expected from hierarchical mergers. Since for m1 < 18 M⊙, the expected value lies outside the population 90% contours, in this mass range, the data do not require a subdominant population of hierarchical mergers. A possible contribution is not excluded in any of the higher-mass intervals. The purple dashed line marks the locus y = −x, corresponding to support intervals that are symmetric about χeff = 0. They light gray region marks the forbidden region where ﹩{\chi }_{{\rm{eff}},{\rm{\min }}}\gt {\chi }_{{\rm{eff}},{\rm{\max }}}﹩.
Other Images in This Article
Copyright and Terms & Conditions
© 2026. The Author(s). Published by the American Astronomical Society.

