

Image Details
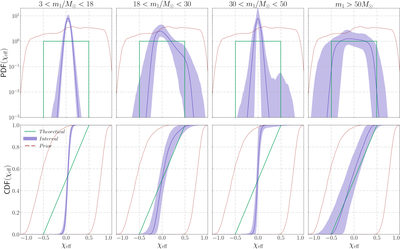
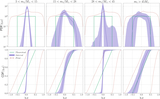
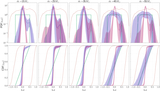
Caption: Figure 3.
Inferred effective-spin distributions across the four mass intervals identified from the mass-ratio analysis: m1 < 18 M⊙, 18 < m1/M⊙ < 30, 30 < m1/M⊙ < 50, and m1 > 50 M⊙. The top panels show the probability density functions, and the bottom panels show the corresponding cumulative distributions. Shaded regions show the 90% confidence intervals, and solid lines show the recovered median distribution. Red dotted lines show the prior ranges. The green lines indicate the distribution expected if the population formed hierarchically in dense clusters. The four intervals exhibit alternating narrow and broad spin populations, with the m1 < 18 M⊙ and 30 < m1/M⊙ < 50 populations characterized by narrow distributions, while the 18 < m1/M⊙ < 30 and m1 > 50 M⊙ intervals show substantially broader support extending toward both positive and negative effective spins.
Other Images in This Article
Copyright and Terms & Conditions
© 2026. The Author(s). Published by the American Astronomical Society.

