

Image Details
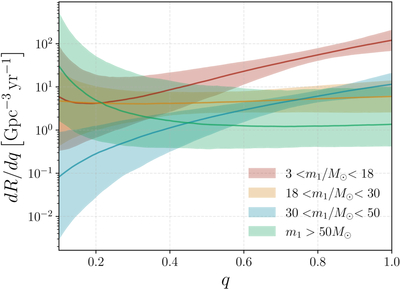
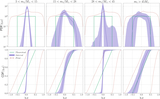
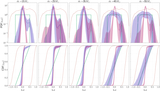
Caption: Figure 2.
The merger rate as a function of mass ratio q for each mass interval. The shaded region represents the 90% confidence interval, and the solid line is the median. Intervals 18 < m1/M⊙ < 30 and m1 > 50M⊙ show a flattening in the merger rate in comparison to m1 < 18M⊙ and 30 < m1/M⊙ < 50.
Other Images in This Article
Copyright and Terms & Conditions
© 2026. The Author(s). Published by the American Astronomical Society.

Copyright ©
2026 Astronomy Image Explorer. All Rights Reserved.
