

Image Details
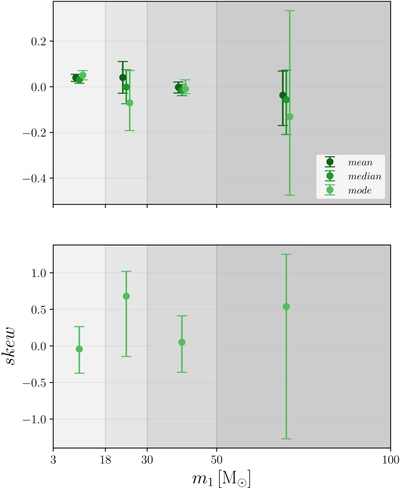
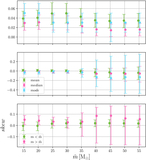
Caption: Figure 4.
Summary statistics of the inferred effective-spin distributions across the four mass intervals identified from the mass-ratio analysis: m1 < 18 M⊙, 18 < m1/M⊙ < 30, 30 < m1/M⊙ < 50, and m1 > 50 M⊙. Error bars indicate the 90% credible intervals. The upper panel shows the mean, median, and mode of the inferred χeff distributions, while the lower panel shows the corresponding Pearson first skewness coefficient. The latter is computed with respect to the mode of the distribution.
Other Images in This Article
Copyright and Terms & Conditions
© 2026. The Author(s). Published by the American Astronomical Society.

Copyright ©
2026 Astronomy Image Explorer. All Rights Reserved.
