

Image Details
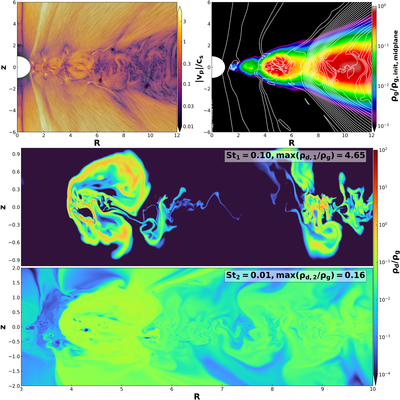
Caption: Figure A1.
The top-left panel shows the poloidal gas velocity normalized by the sound speed, similar to Figure 1. The top-right panel shows the normalized gas density together with the magnetic flux, similar to Figure 2. The bottom panels present the dust–gas density ratios for two dust species (St1 = 0.1 and St2 = 0.01), similar to Figure 5. The maximum dust–gas ratios for the two species are indicated in the top-right corners of the corresponding panels.
Other Images in This Article
Copyright and Terms & Conditions
© 2026. The Author(s). Published by the American Astronomical Society.

Copyright ©
2026 Astronomy Image Explorer. All Rights Reserved.
