

Image Details
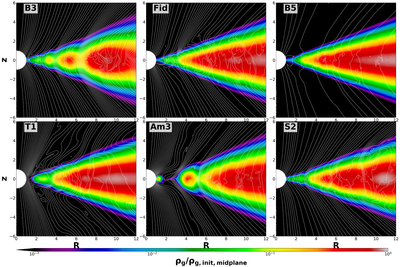
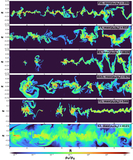
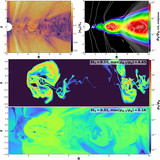
Caption: Figure 2.
The gas density normalized by the initial density profile in the midplane, ρg/ρg,init,midplane at the final snapshots for different models (taken at t = 2000P0 for all models except “S2,” which is shown at t = 2200P0). The contours indicate the poloidal magnetic flux.
Other Images in This Article
Copyright and Terms & Conditions
© 2026. The Author(s). Published by the American Astronomical Society.

Copyright ©
2026 Astronomy Image Explorer. All Rights Reserved.
