

Image Details
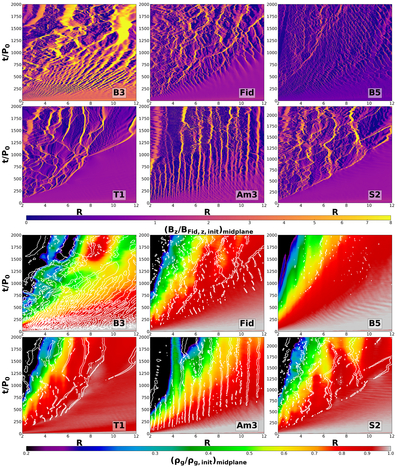
Caption: Figure 7.
The top six panels show spacetime (R–t) diagrams of the vertical magnetic field in the midplane (z = 0, θ = π/2) for different models, normalized to the initial value in the fiducial run, ﹩{({B}_{z}/{B}_{{\rm{Fid}},z,{\rm{init}}})}_{{\rm{midplane}}}﹩. The bottom six panels show spacetime (R–t) diagrams of the gas density normalized by the initial profile in the midplane, ﹩{({\rho }_{{\rm{g}}}/{\rho }_{{\rm{g}},{\rm{init}}})}_{{\rm{midplane}}}﹩. The white contours indicate the midplane vertical magnetic field normalized by its initial value in the fiducial run, ﹩{({B}_{z}/{B}_{{\rm{Fid}},z,{\rm{init}}})}_{{\rm{midplane}}}=3﹩. The contours are smoothed using a moving average with a window of 25P0 along the time axis.
Other Images in This Article
Copyright and Terms & Conditions
© 2026. The Author(s). Published by the American Astronomical Society.

