

Image Details
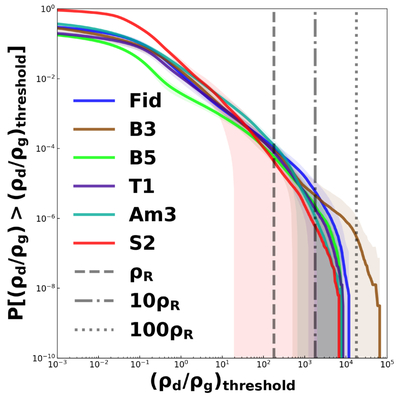
Caption: Figure 4.
The CDFs of the dust–gas density ratio, computed by counting the number of grid cells, ﹩P[({\rho }_{{\rm{d}}}/{\rho }_{{\rm{g}}})\gt {({\rho }_{{\rm{d}}}/{\rho }_{{\rm{g}}})}_{{\rm{threshold}}}]﹩. The CDFs are calculated using data from the last 500 innermost orbits (1500P0–2000P0 for all models except “S2”, for which 1700P0–2200P0 is used). The solid lines and shaped regions are the temporal averages and standard deviations. The calculation of the CDFs covers R ∈ [3, 10] and ﹩z\in [-{z}_{{\rm{tr}}},\,{z}_{{\rm{tr}}}]﹩. For the CDF calculation across different refinement levels, cells on coarser levels are converted into an equivalent number of finest-level cells before performing the statistics.
Other Images in This Article
Copyright and Terms & Conditions
© 2026. The Author(s). Published by the American Astronomical Society.

