

Image Details
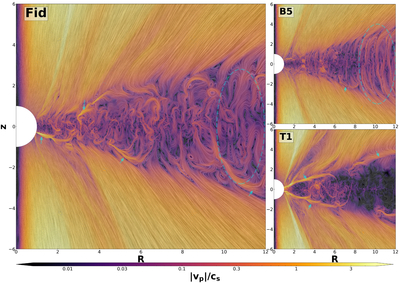
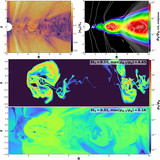
Caption: Figure 1.
Linear integral convolution (LIC) visualization of the poloidal (meridional) gas velocity field, normalized by the sound speed (∣vp∣/cs), for the “Fid,” “B5,” and “T1” models at the final simulation snapshot (t = 2000P0). Model names are labeled in the top-left corner of each panel. The poloidal velocity structures in “B3,” “Am3,” and “S2” are qualitatively similar to those in “Fid” and are therefore omitted for clarity. The cyan arrows mark the locations of current sheets, while the cyan dashed ellipses highlight the VSI corrugation and higher-order body modes.
Other Images in This Article
Copyright and Terms & Conditions
© 2026. The Author(s). Published by the American Astronomical Society.

Copyright ©
2026 Astronomy Image Explorer. All Rights Reserved.
