

Image Details
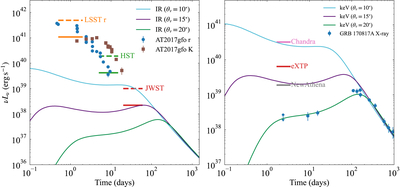
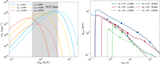
Caption: Figure 9.
Detectability of the kilonova and afterglow. Left panel: the infrared afterglows at viewing angles θv = 10∘, 15∘, and 20∘, together with the kilonova emission. The deep blue circles and brown squares show the r- and K-band observations of AT2017gfo, respectively. The orange, green, and red horizontal lines indicate the sensitivities of LSST r, HST F160W (M. Marinelli & J. Green 2025), and JWST F150W2, respectively, at z = 0.1 (solid lines) and z = 0.2 (dashed lines). Right panel: the keV X-ray afterglow of the jet–cocoon at the same viewing angles. The deep blue circles show the X-ray observations of GRB 170817A. The magenta, red, and gray horizontal lines show the approximate Chandra, eXTP, and NewAthena sensitivities, respectively, for a source at z = 0.1.
Other Images in This Article
Copyright and Terms & Conditions
© 2026. The Author(s). Published by the American Astronomical Society.

