

Image Details
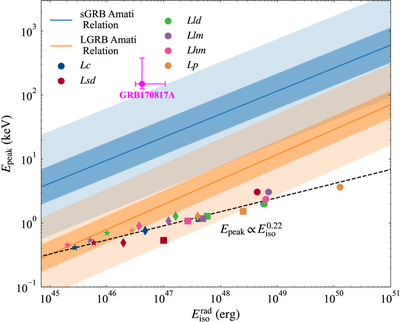
Caption: Figure 7.
The ﹩{E}_{{\rm{iso}}}^{{\rm{rad}}}﹩ vs. Epeak diagram. The blue solid and orange lines show the Amati relation for the SGRB (Type-I GRB) and LGRB (Type-II GRB) populations, adopted from Y. Liu et al. (2025). The dark- and light- shaded regions indicate the 1σ and 3σ confidence intervals, respectively. The magenta point marks GRB 170817A. Colors represent different models, while the circles (θv = 10∘), squares (θv = 20∘), diamonds (θv = 30∘), and stars (θv = 45∘) denote different viewing angles.
Other Images in This Article
Copyright and Terms & Conditions
© 2026. The Author(s). Published by the American Astronomical Society.

Copyright ©
2026 Astronomy Image Explorer. All Rights Reserved.
