

Image Details
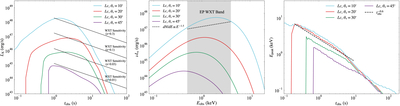
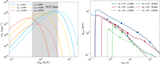
Caption: Figure 3.
X-ray lightcurves and spectra of the canonical model (Lc). Left panel: X-ray lightcurves in the EP-WXT band (0.5–4 keV). The blue, red, green, and purple lines correspond to the viewing angles of 10∘, 20∘, 30∘, and 45∘. The black solid lines indicate the EP-WXT sensitivity limits taken from W. Yuan et al. (2022) for sources at redshifts z = 0.01–0.3. Middle panel: the T90-averaged spectra at different viewing angles. The gray shaded region marks the EP-WXT band, while the black dashed line denotes a power-law spectrum with a photon index of 1.5. Right panel: the temporal evolution of the peak energy in the Lc model. The black dashed line indicates a power-law decay ﹩{E}_{{\rm{peak}}}\propto {t}_{{\rm{obs}}}^{-0.6}﹩.
Other Images in This Article
Copyright and Terms & Conditions
© 2026. The Author(s). Published by the American Astronomical Society.

