

Image Details
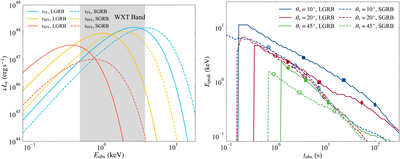
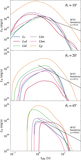
Caption: Figure A1.
Left panel: time-resolved spectra of the canonical LGRB (solid lines) and SGRB (dashed lines) cocoon models at θv = 10∘. The blue, yellow, and red curves correspond to tobs = t5%, t50%, and t95%, marking the beginning, midpoint, and end of the T90 interval, respectively. All spectra are quasi-thermal. Right panel: temporal evolutions of the peak energy for the canonical LGRB (solid lines) and SGRB (dashed lines) cocoon models. The blue, red, and green curves correspond to θv = 10∘, 20∘, and 45∘, respectively. Circles, squares, and diamonds mark tobs = t5%, t50%, and t95%, respectively. Open and filled symbols denote the LGRB and SGRB cocoons.
Other Images in This Article
Copyright and Terms & Conditions
© 2026. The Author(s). Published by the American Astronomical Society.

