

Image Details
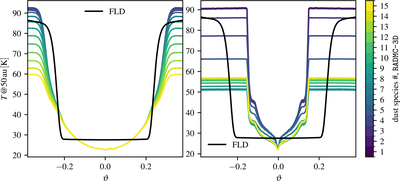
Caption: Figure C1.
Temperature profiles at 50 au distance to star calculated with RADMC-3D (colored lines for different dust species), and temperature profile assumed in the hydrodynamic simulation. Species 1 corresponds to the smallest grains; species 15 to the largest. The left panel corresponds to the initial condition, the right panel corresponds to the last simulation snapshot (after 1500 orbits).
Other Images in This Article
Show More
Copyright and Terms & Conditions
© 2026. The Author(s). Published by the American Astronomical Society.

Copyright ©
2026 Astronomy Image Explorer. All Rights Reserved.
